Industrial & Systems Engineer

Qicheng Fu
From Industrial Data
to Operational Impact

M.Eng. Cornell University · Specializing in inventory intelligence, supply chain optimization, and AI-driven decision support systems.

Cornell
M.Eng. 2026
Penn State
B.S. 2025
Industrial Eng.
Discipline
Systems Eng.
Discipline
Qicheng Fu
Cornell University
M.Eng. Systems Engineering
May 2026 · Ithaca, NY
GPA 3.89
Featured Project

Inventory Intelligence

A production-grade, ERP-integrated inventory decision support system built from the ground up.

★ Personal Project · Nov 2025 – Present

Inventory Intelligence

ERP-Integrated Inventory Decision Support System

Built an end-to-end system connecting directly to Oracle ERP via an automated pipeline, processing live inventory records in real time — delivering operational visibility where it matters most.

  • Automated ERP data pipeline with event-driven inventory sync from Oracle
  • SKU-level demand forecasting, reorder point logic & safety stock recommendations
  • Operational dashboards for inventory KPIs, stock risk alerts & replenishment queues
  • Slow-moving item detection and overstock/understock monitoring
  • AI-generated insights for restocking needs and inventory optimization
  • IE principles: inventory optimization, capacity planning & process improvement
Oracle ERPPythonReactNext.jsInventory OptimizationAI/MLSix SigmaSupply Chain
Inventory Intelligence — Full Breakdown

🎯 Problem Statement

Warehouse and supply chain teams often operate with lagging visibility — relying on manual checks, end-of-day reports, or ad-hoc ERP queries. This leads to stockouts, excess carrying costs, and reactive replenishment. Inventory Intelligence solves this with a real-time, AI-assisted decision layer on top of Oracle ERP.

📸 Product Walkthrough

Full product walkthrough. Live screens from the dashboard, data pipeline, search, forecasting, marketing, AI assistant, alerting, and role-based reporting modules.
Operations Dashboard
Core Overview
Operations Dashboard

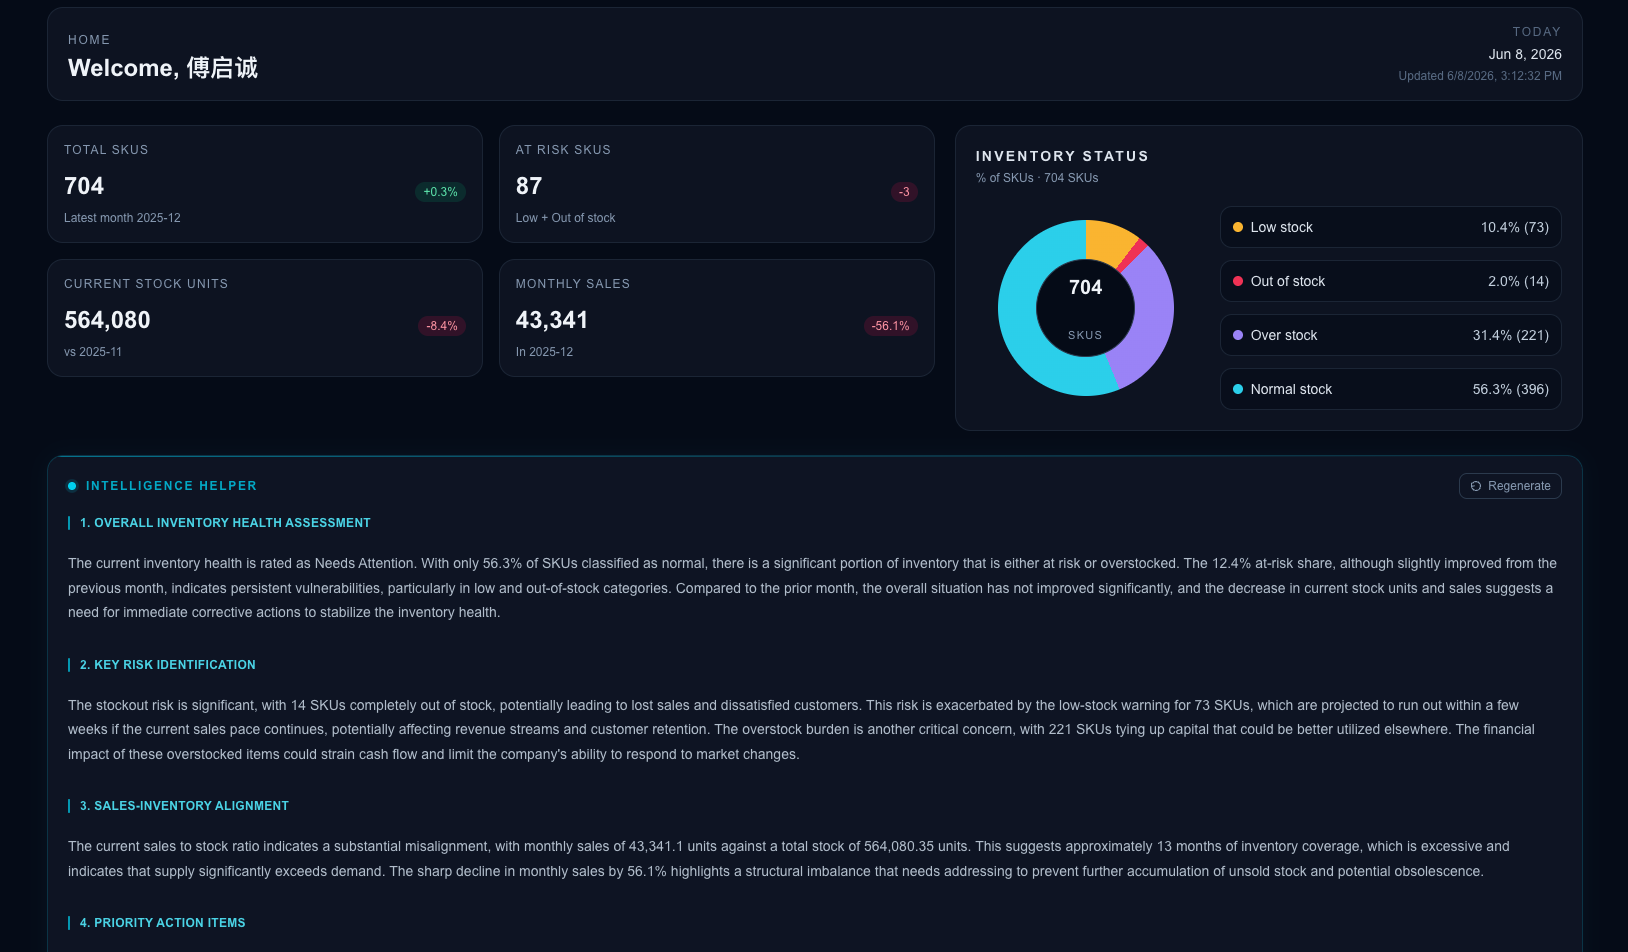
This is the executive landing view for the system, summarizing total SKUs, stock risk, sales movement, and AI-generated health assessment so users can understand inventory exposure in seconds.

Data Center
Data Pipeline
Data Center

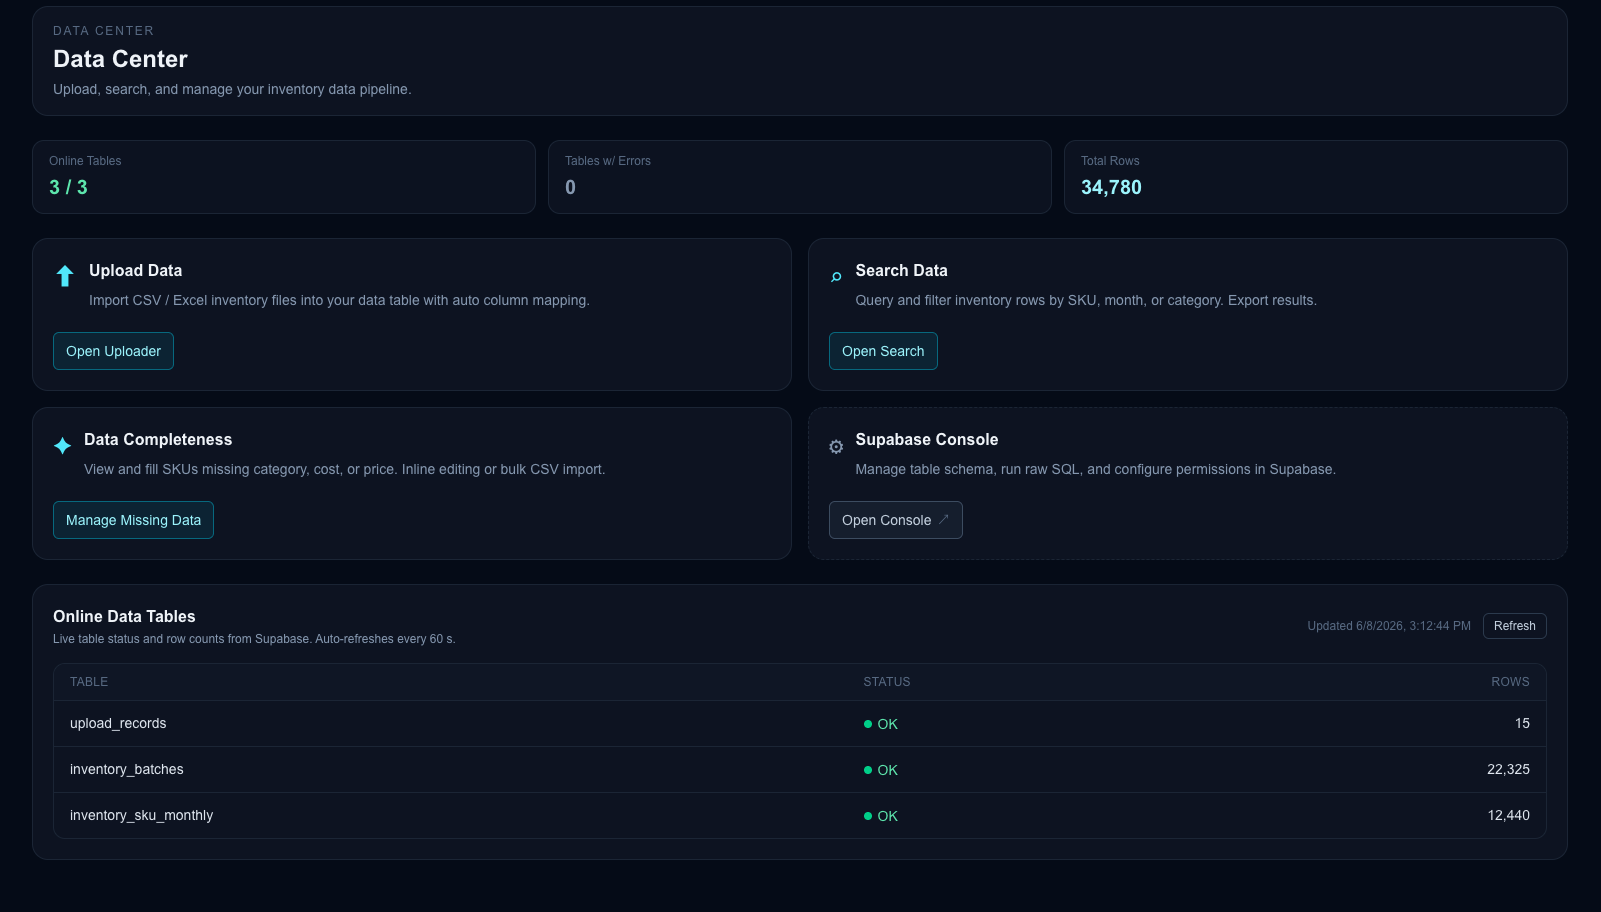
The data center monitors table availability, ingestion health, and row counts, giving operations teams a clear control panel for the inventory data backbone behind every downstream analysis.

Upload and Parse Workflow
Ingestion
Upload and Parse Workflow

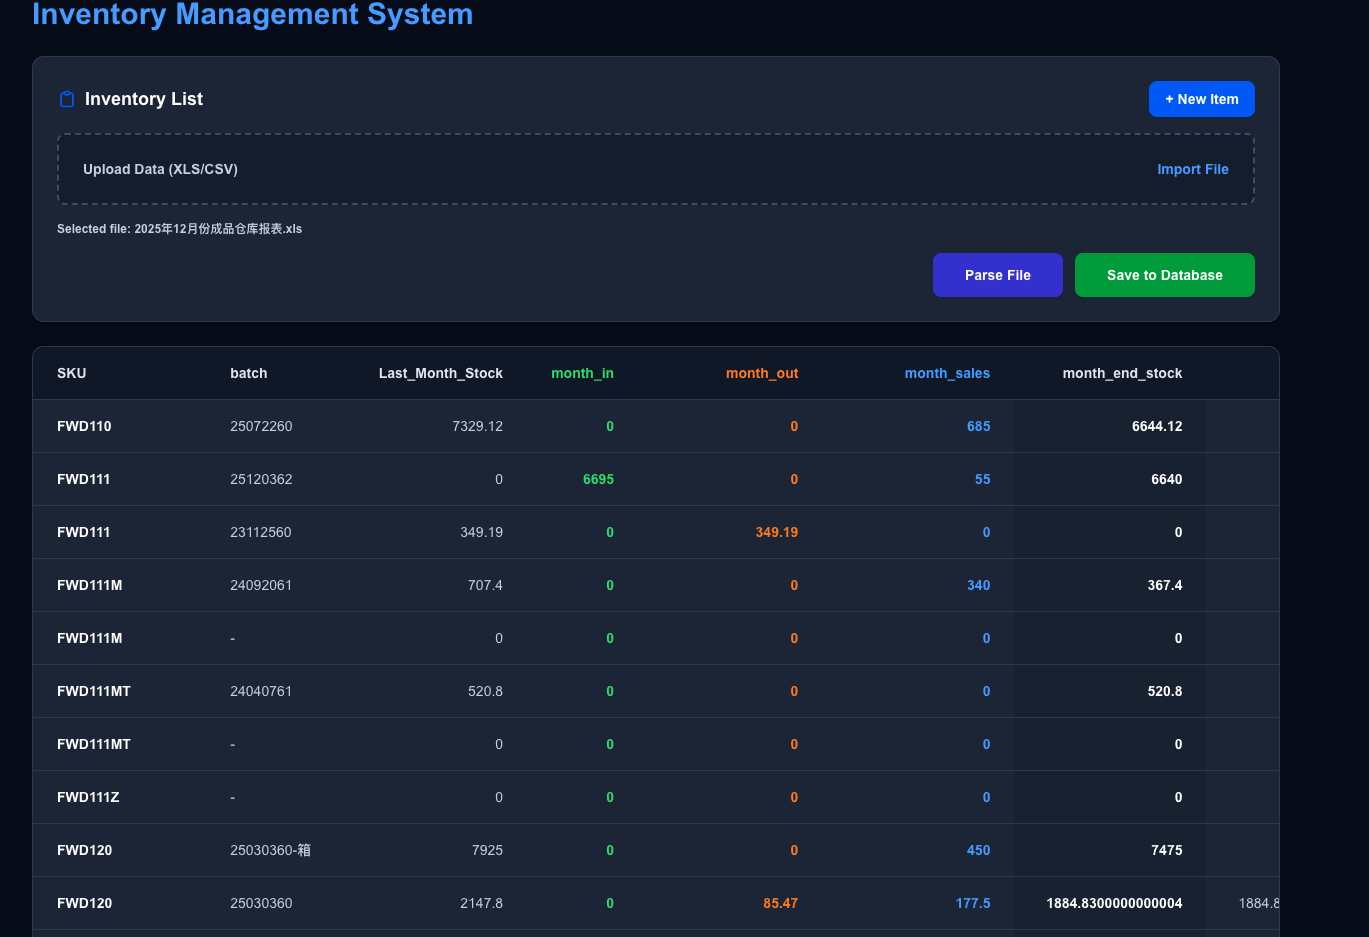
This interface turns raw XLS or CSV files into structured inventory records, allowing users to import new monthly snapshots, validate the parsed schema, and save clean data directly to the database.

Search and Filtering
Query Layer
Search and Filtering

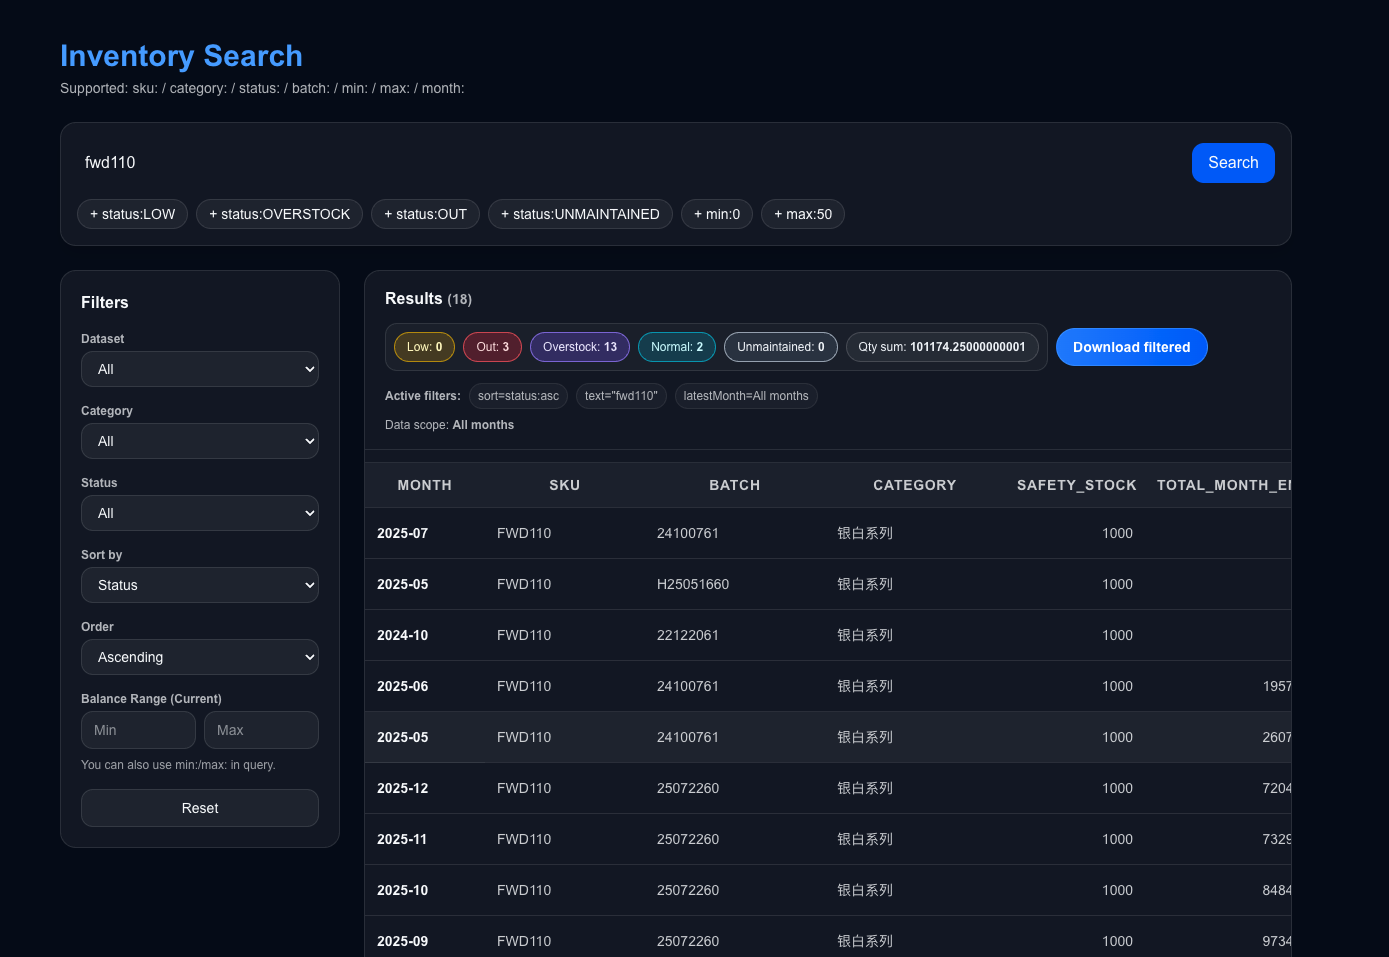
Users can query the inventory by SKU, category, batch, status, and balance thresholds, then export filtered results for investigation, operational follow-up, or ad hoc reporting.

Demand Forecasting
Forecasting
Demand Forecasting

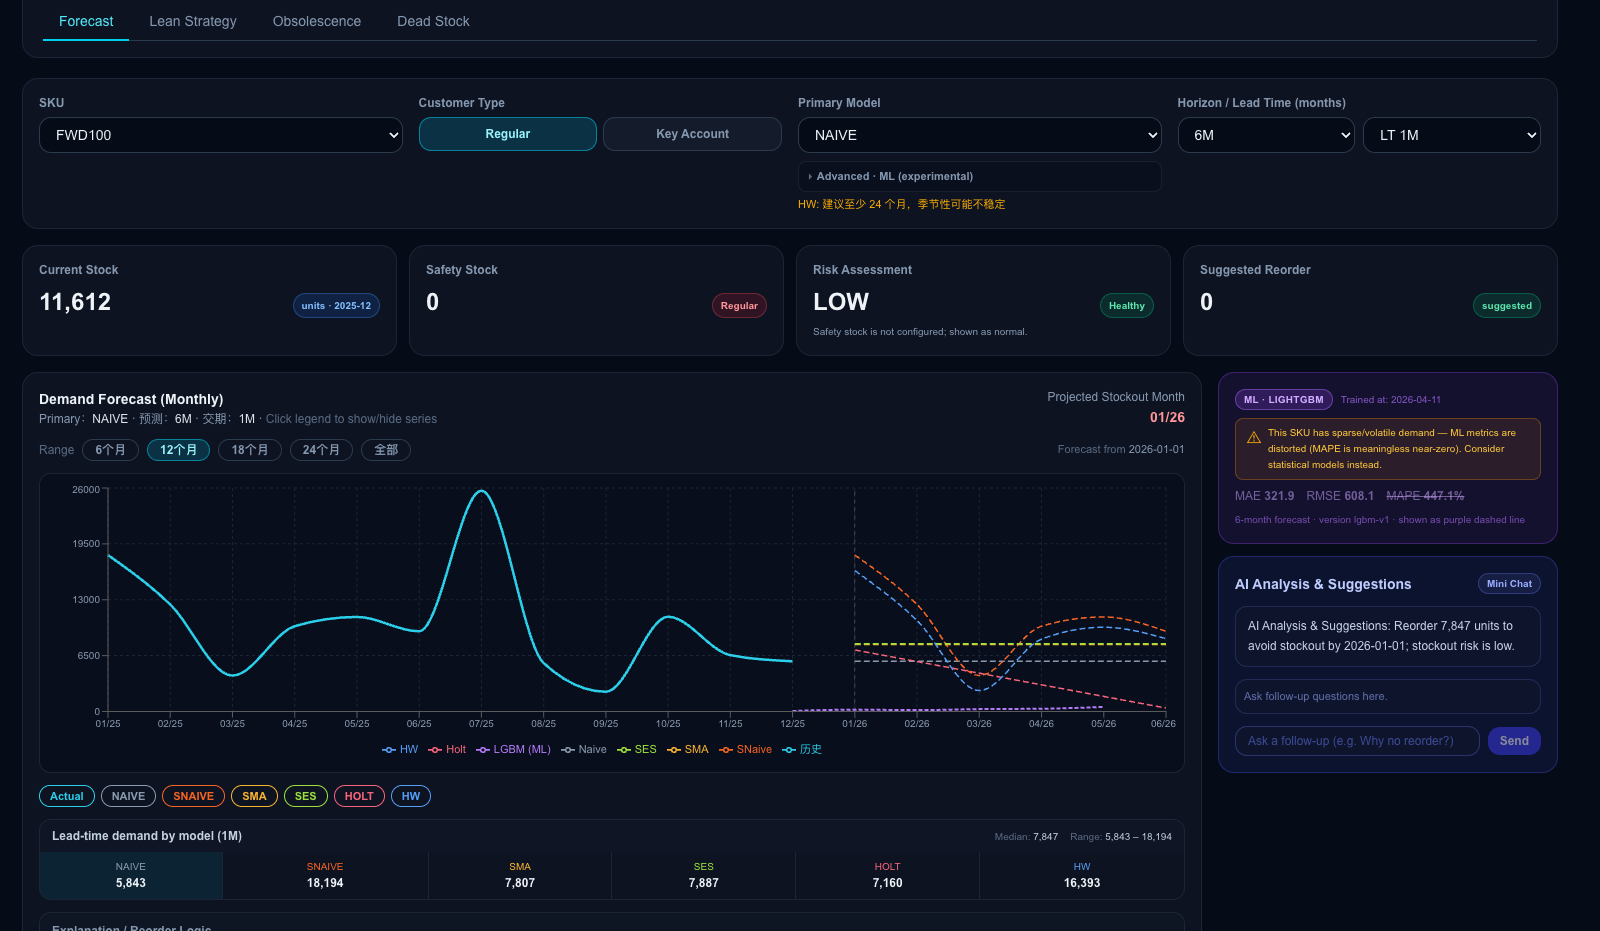
This module compares multiple forecasting models, estimates lead-time demand, highlights stockout timing, and surfaces reorder suggestions with an AI explanation layer for planners.

Lean Strategy Overview
Lean Analysis
Lean Strategy Overview

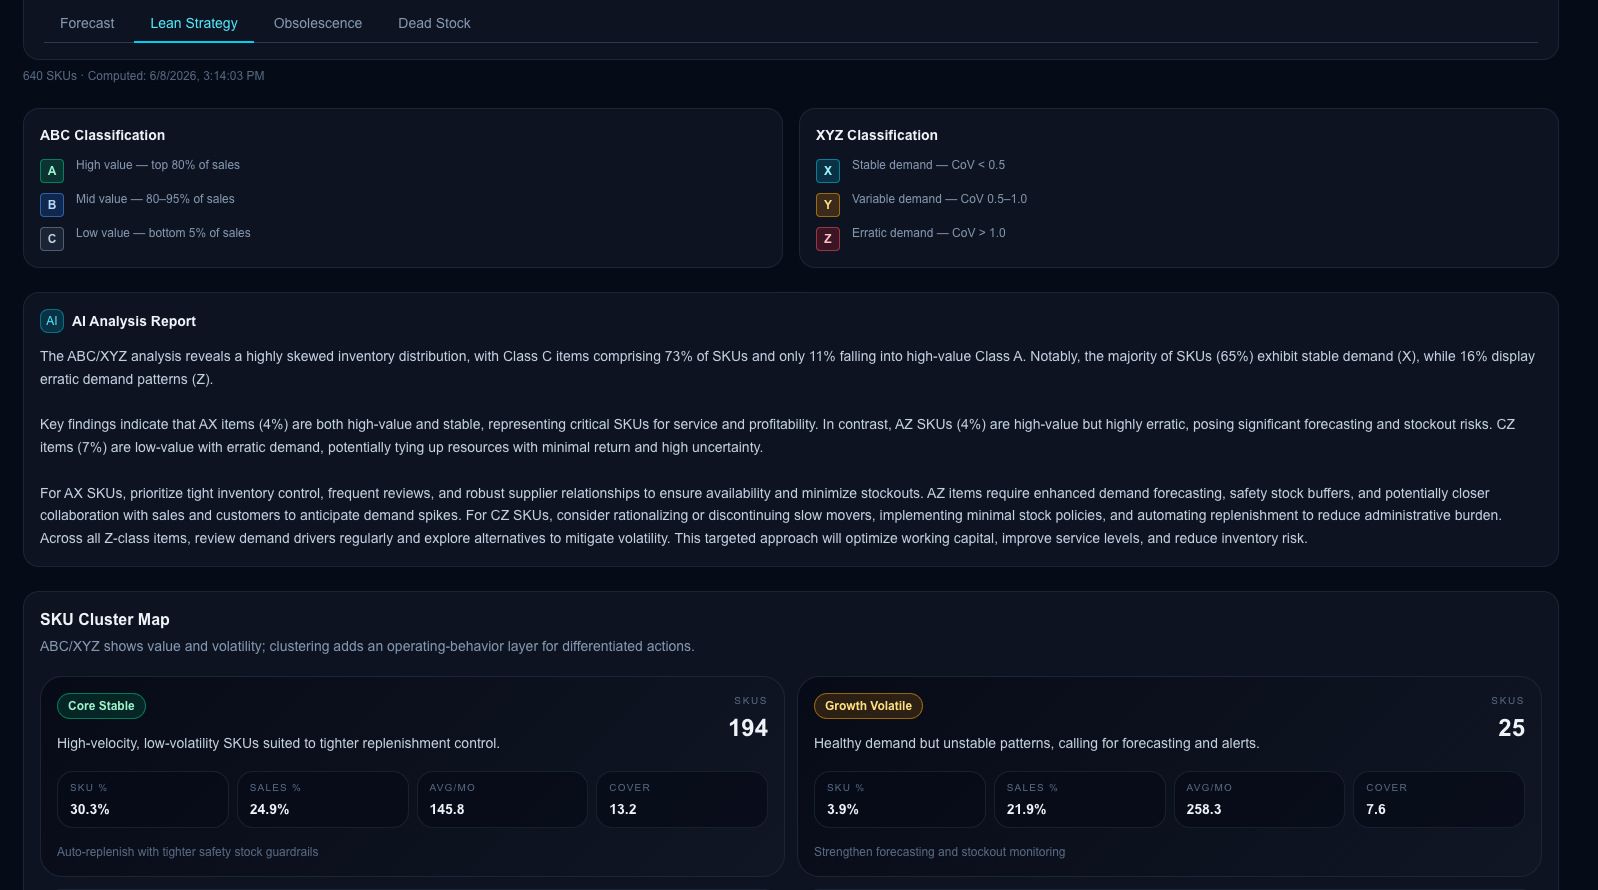
The lean strategy layer classifies demand stability and value concentration, then translates those patterns into differentiated operating strategies that reduce working capital without sacrificing service.

ABC/XYZ Strategy Matrix
Policy Design
ABC/XYZ Strategy Matrix

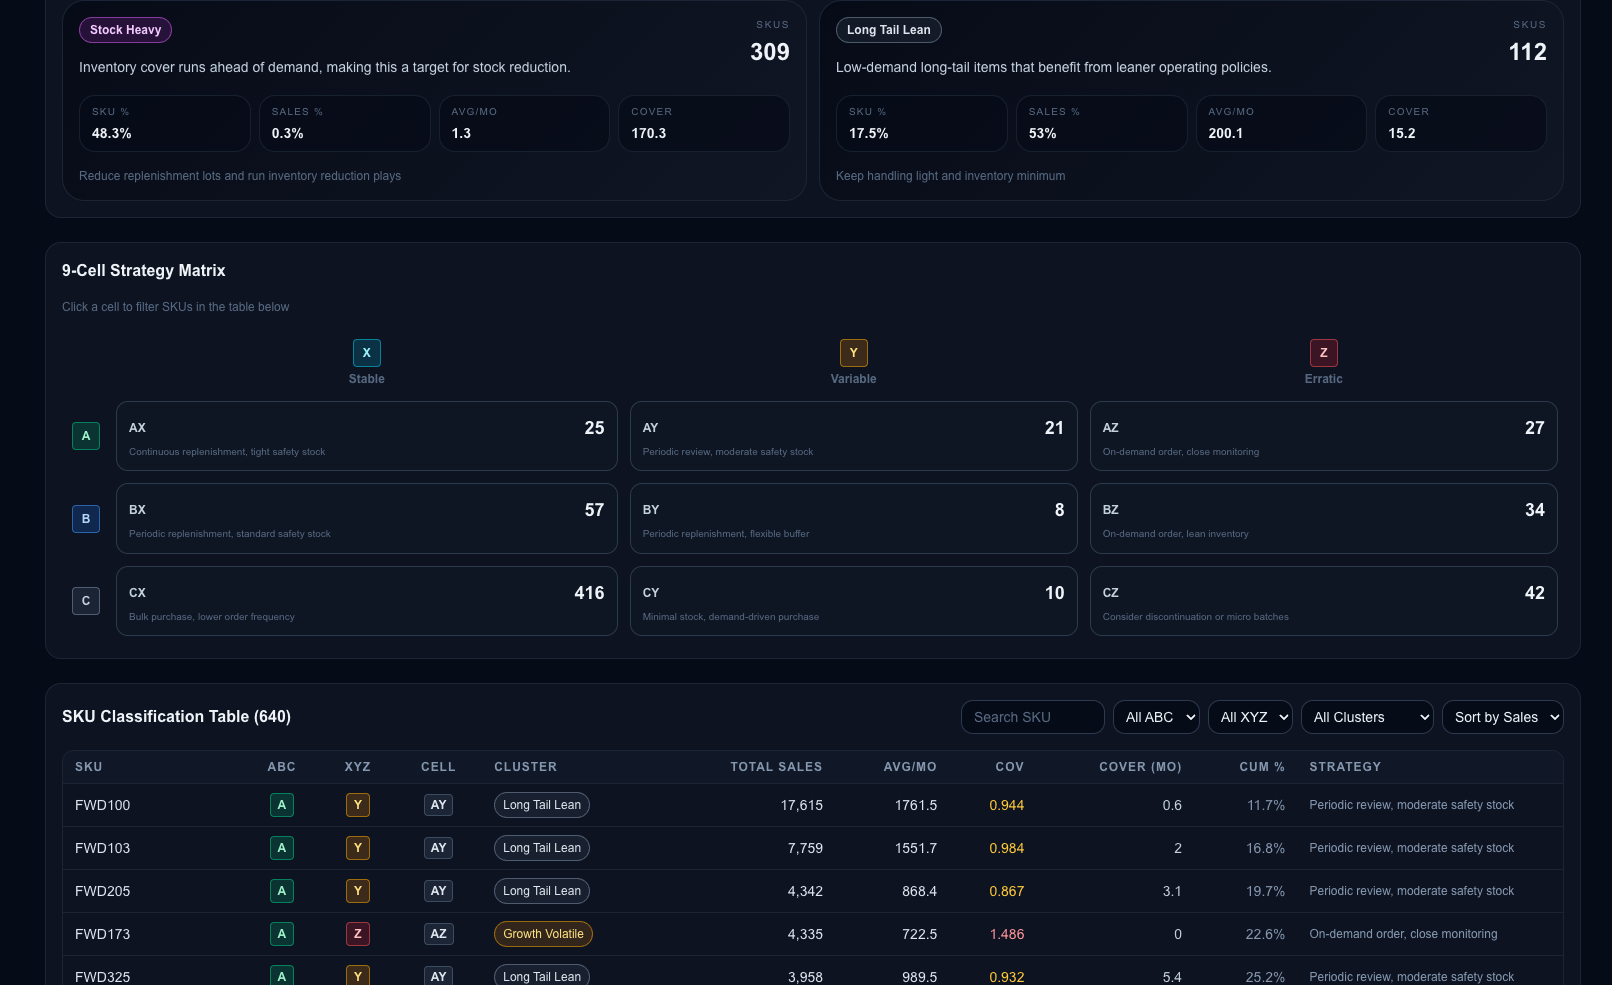
This view maps SKUs into a nine-cell policy matrix so teams can assign replenishment cadence, safety stock posture, and review discipline based on both value and volatility.

Obsolescence Analysis
Aging Inventory
Obsolescence Analysis

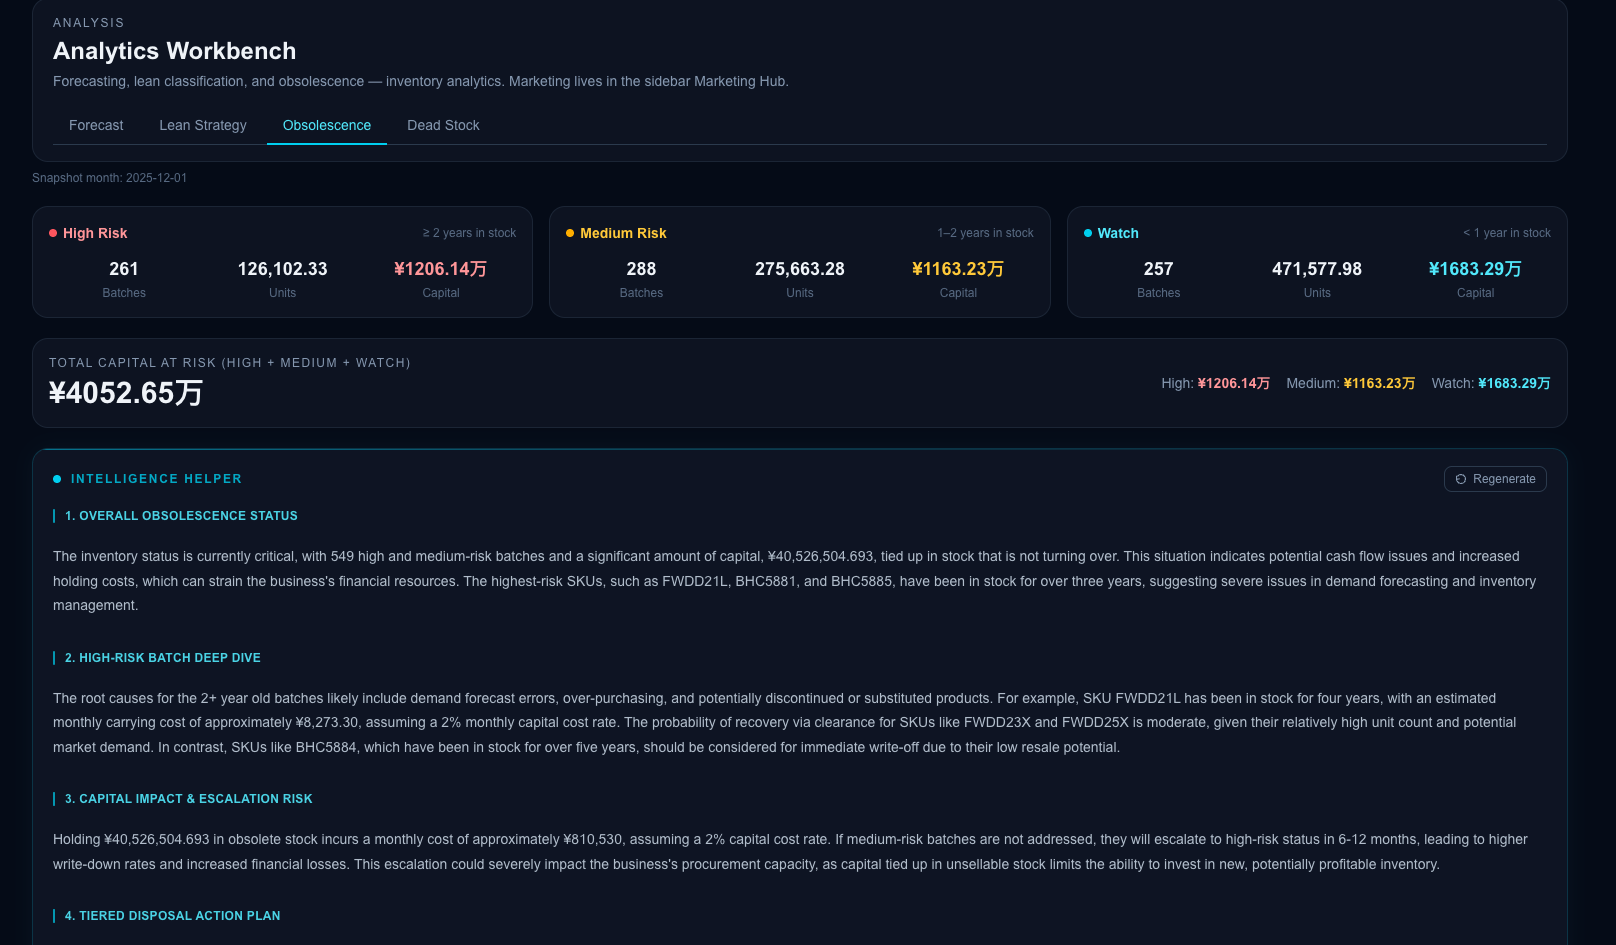
This screen quantifies aging inventory exposure by time-in-stock and capital at risk, then uses AI to summarize the financial implications and escalation paths if action is delayed.

Dead Stock Prioritization
Risk Prioritization
Dead Stock Prioritization

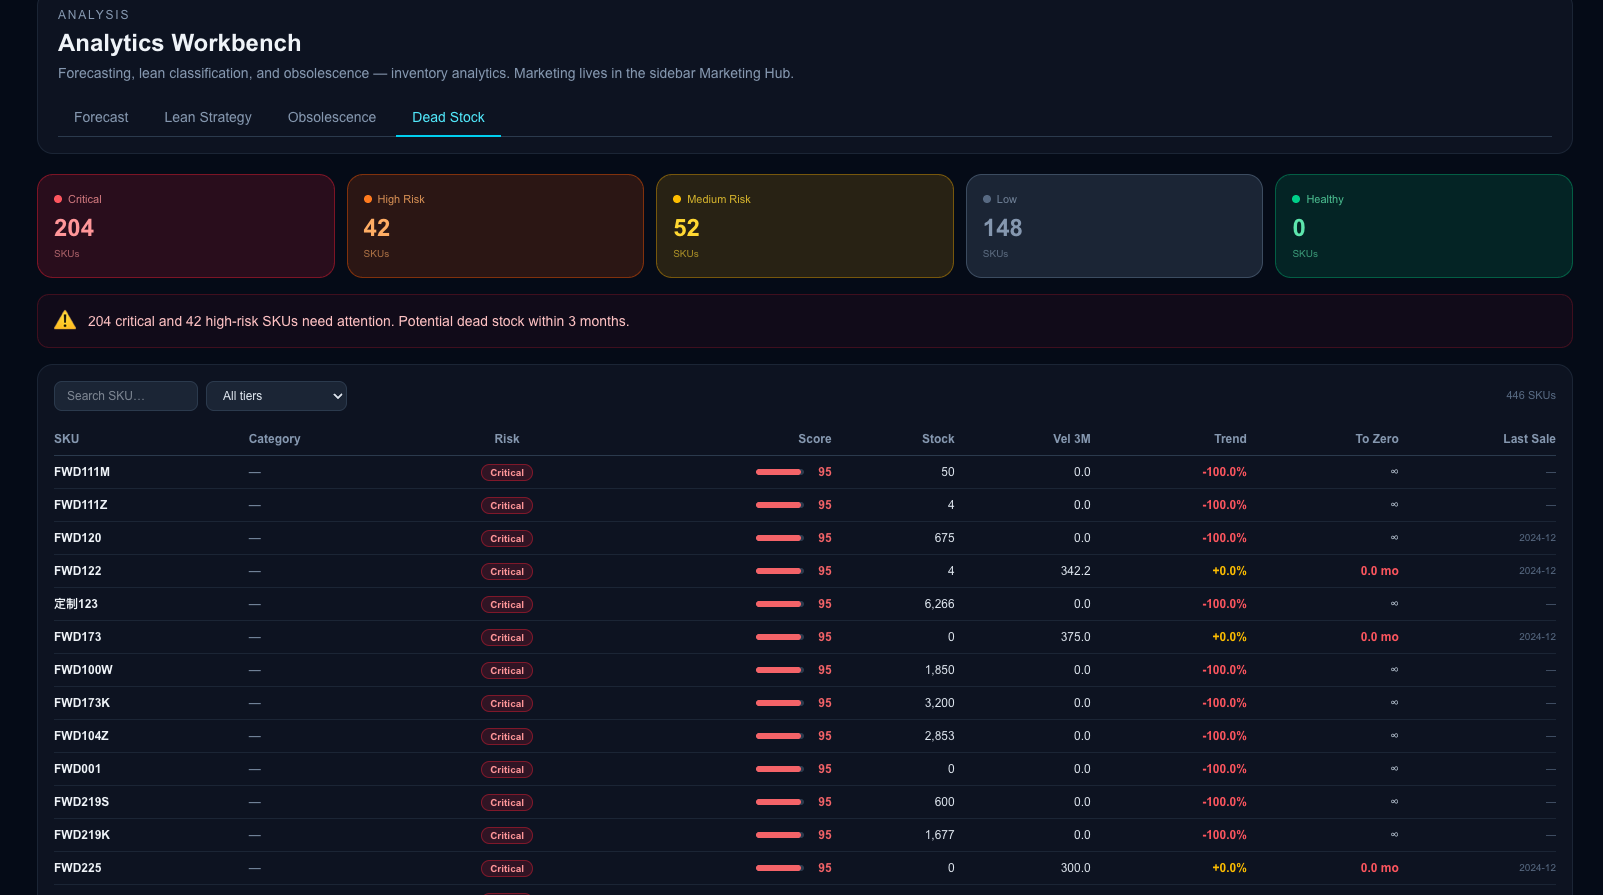
The dead stock monitor scores inactive SKUs by risk, run-out trend, and time to zero so teams can quickly identify which items need liquidation, reset thresholds, or replenishment suspension.

Marketing Hub Leaderboard
Commercial View
Marketing Hub Leaderboard

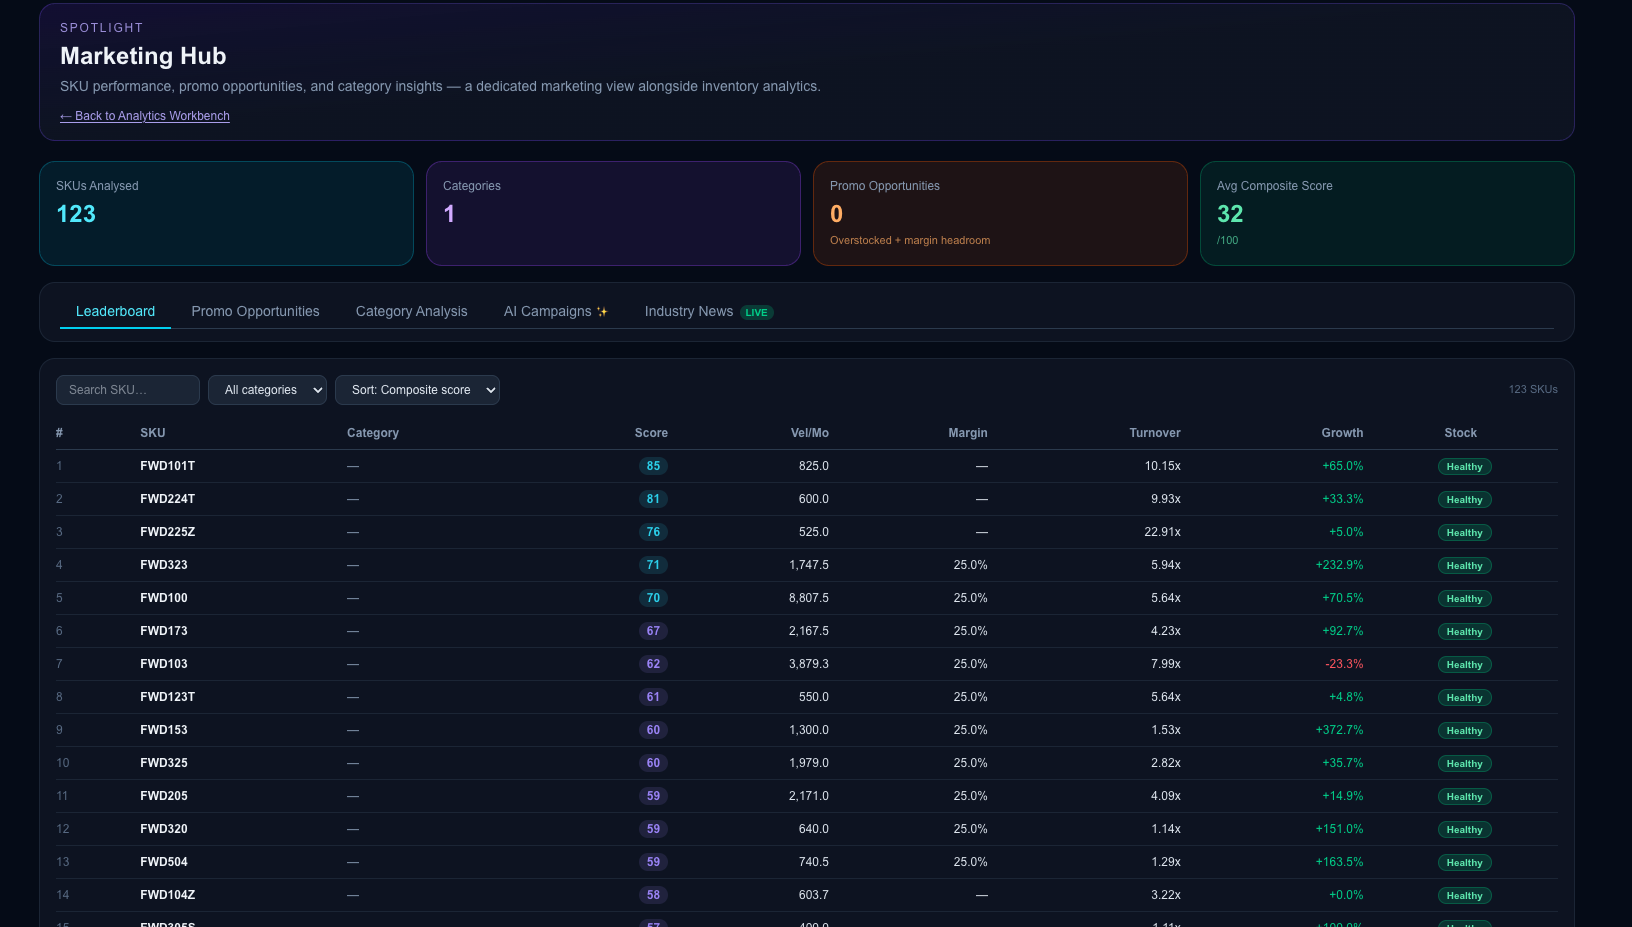
Beyond operations, the system includes a commercial layer that ranks SKUs by composite opportunity score, helping marketing teams spot high-turnover items, healthy stock, and growth-friendly campaigns.

Industry News and AI Marketing Insights
External Signals
Industry News and AI Marketing Insights

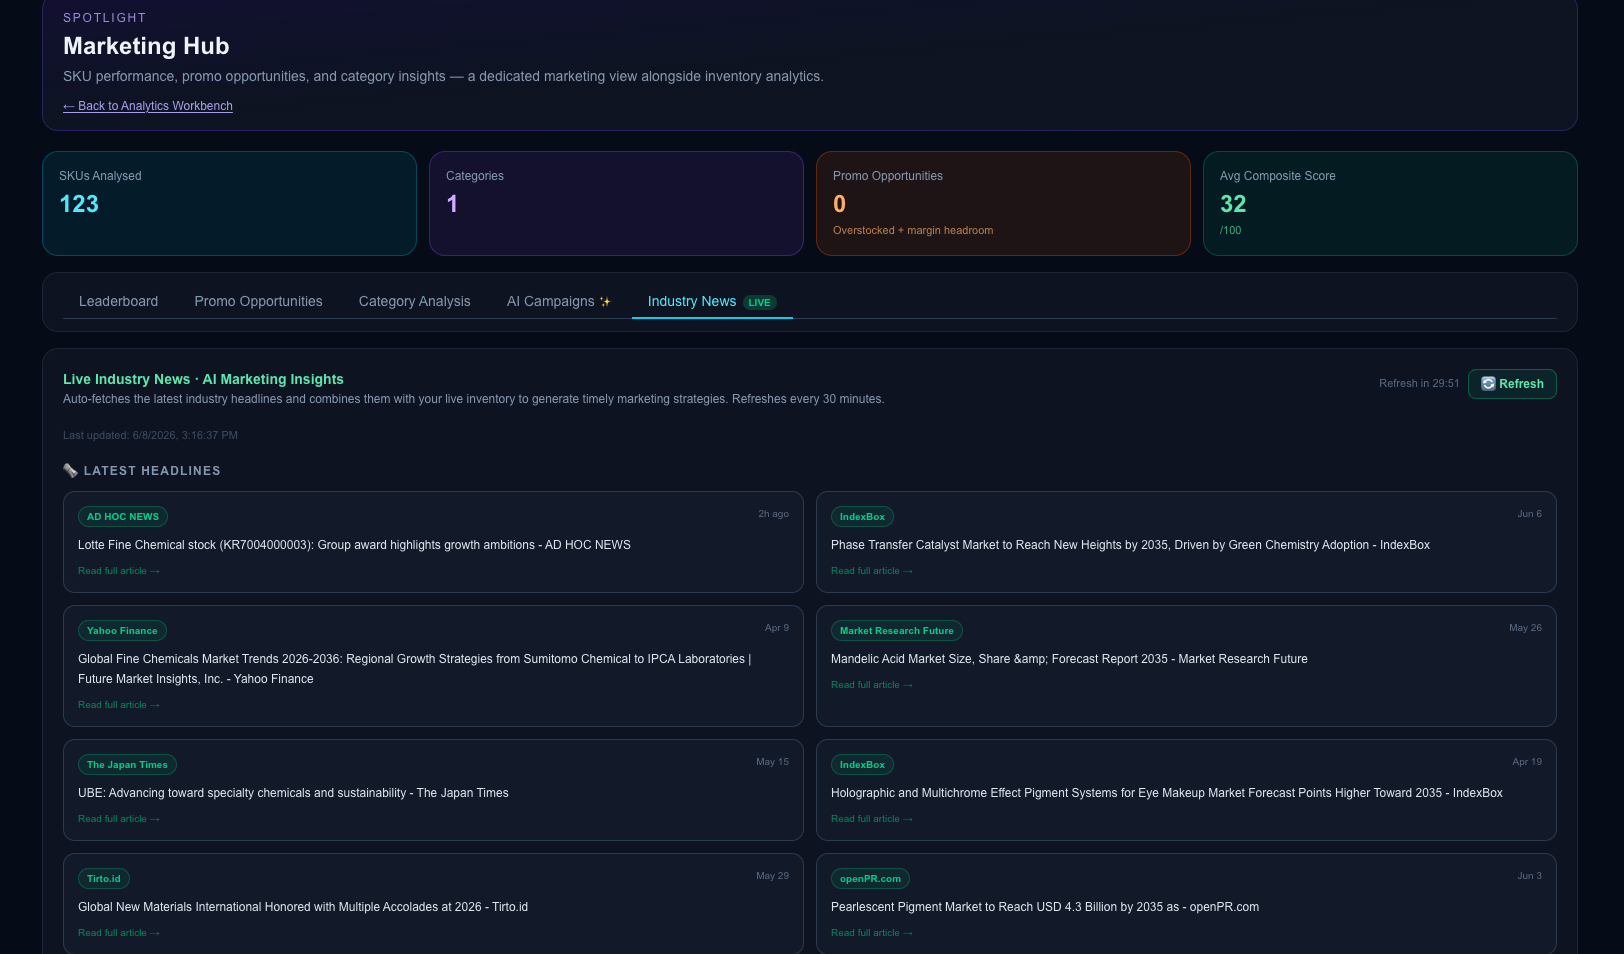
This module pulls live market headlines and combines them with current inventory context so commercial teams can react to industry shifts, promotional openings, and category-specific demand signals.

Ask Your Data
Conversational AI
Ask Your Data

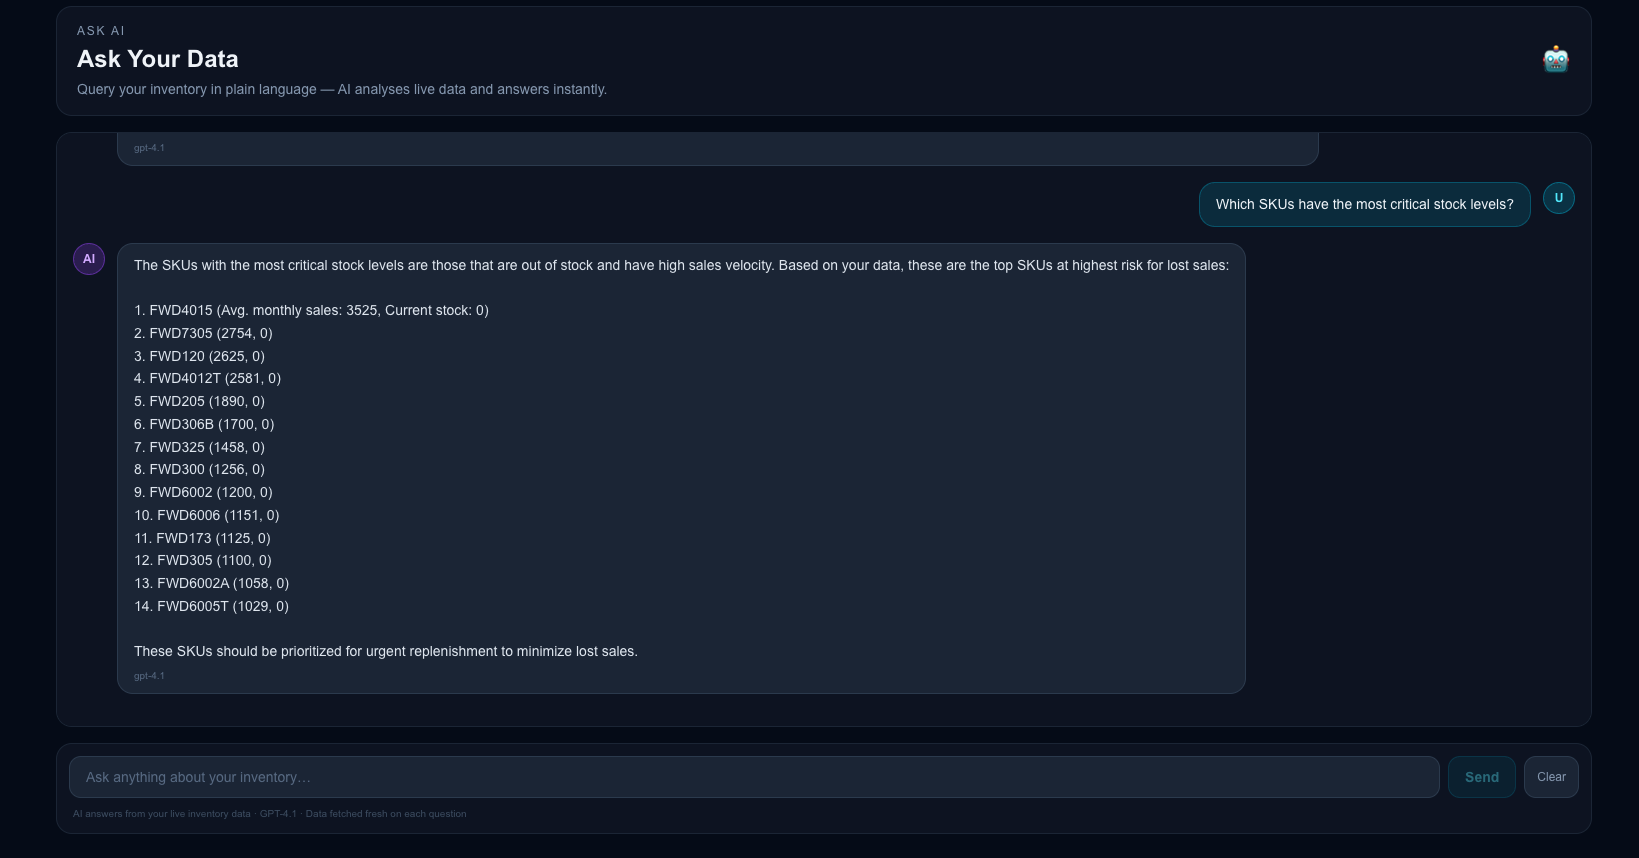
Users can ask plain-language questions such as which SKUs are most critical, and the assistant answers directly from live inventory data with actionable, ranked recommendations instead of forcing manual analysis.

Daily Alert Digest
Daily Actions
Daily Alert Digest

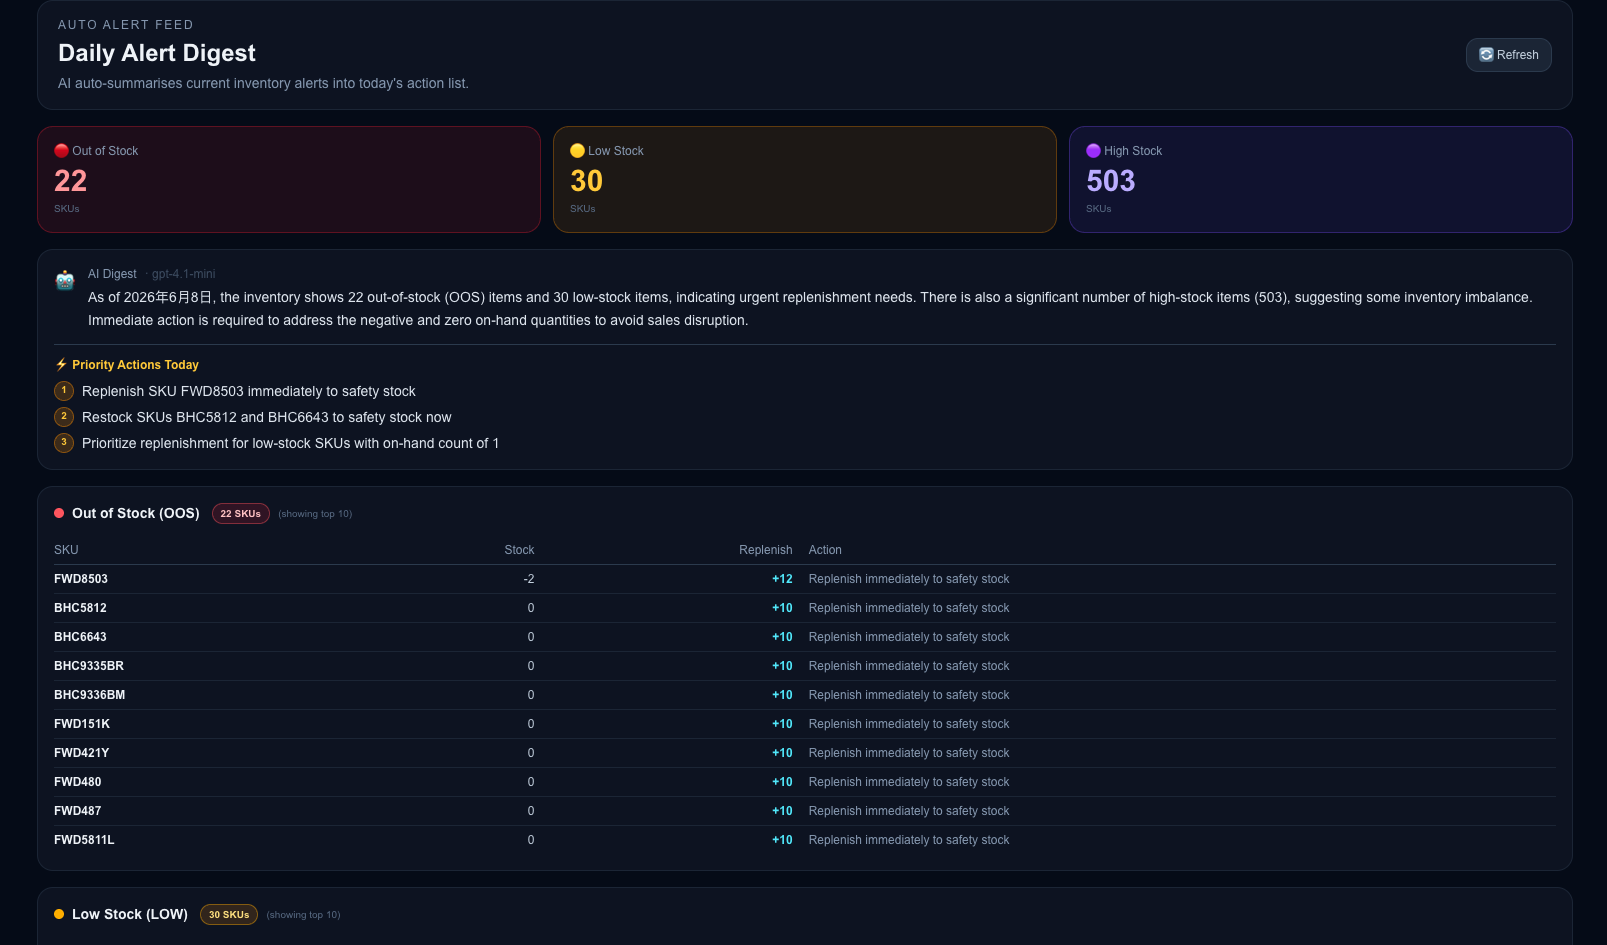
The digest converts raw OOS, low-stock, and high-stock signals into a daily action list, prioritizing what should be replenished first and giving supervisors a ready-made execution queue.

Inventory Alert Center
Threshold Control
Inventory Alert Center

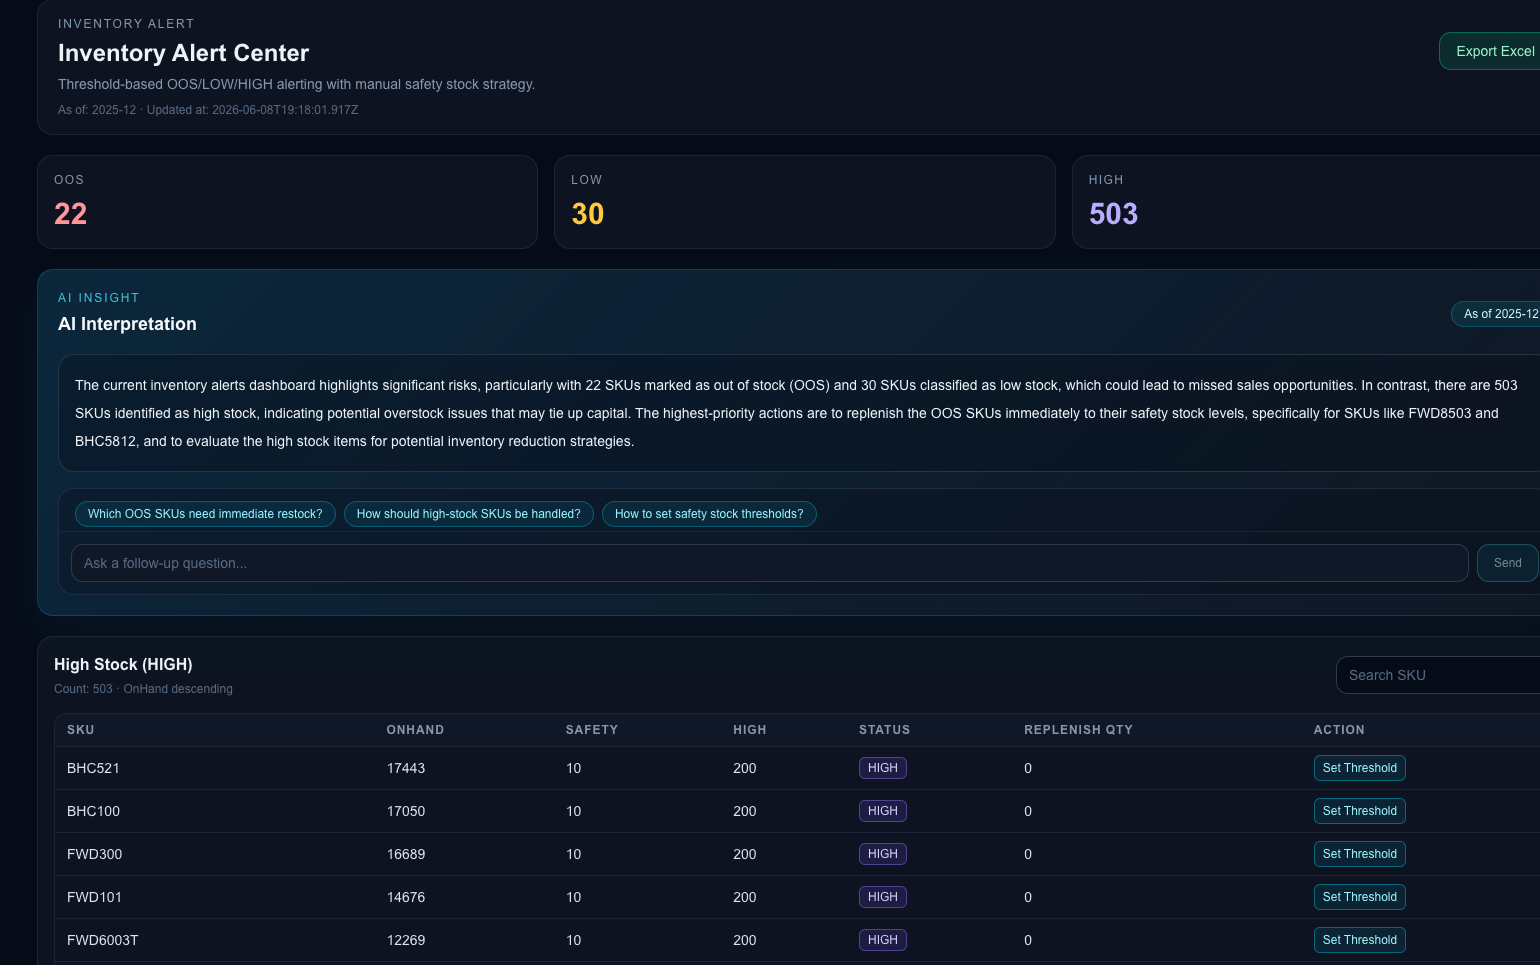
This alert center gives planners a more detailed control surface for threshold-based OOS, LOW, and HIGH logic, combining AI interpretation with SKU-level follow-up actions and export capability.

AI Report Generator
Executive Reporting
AI Report Generator

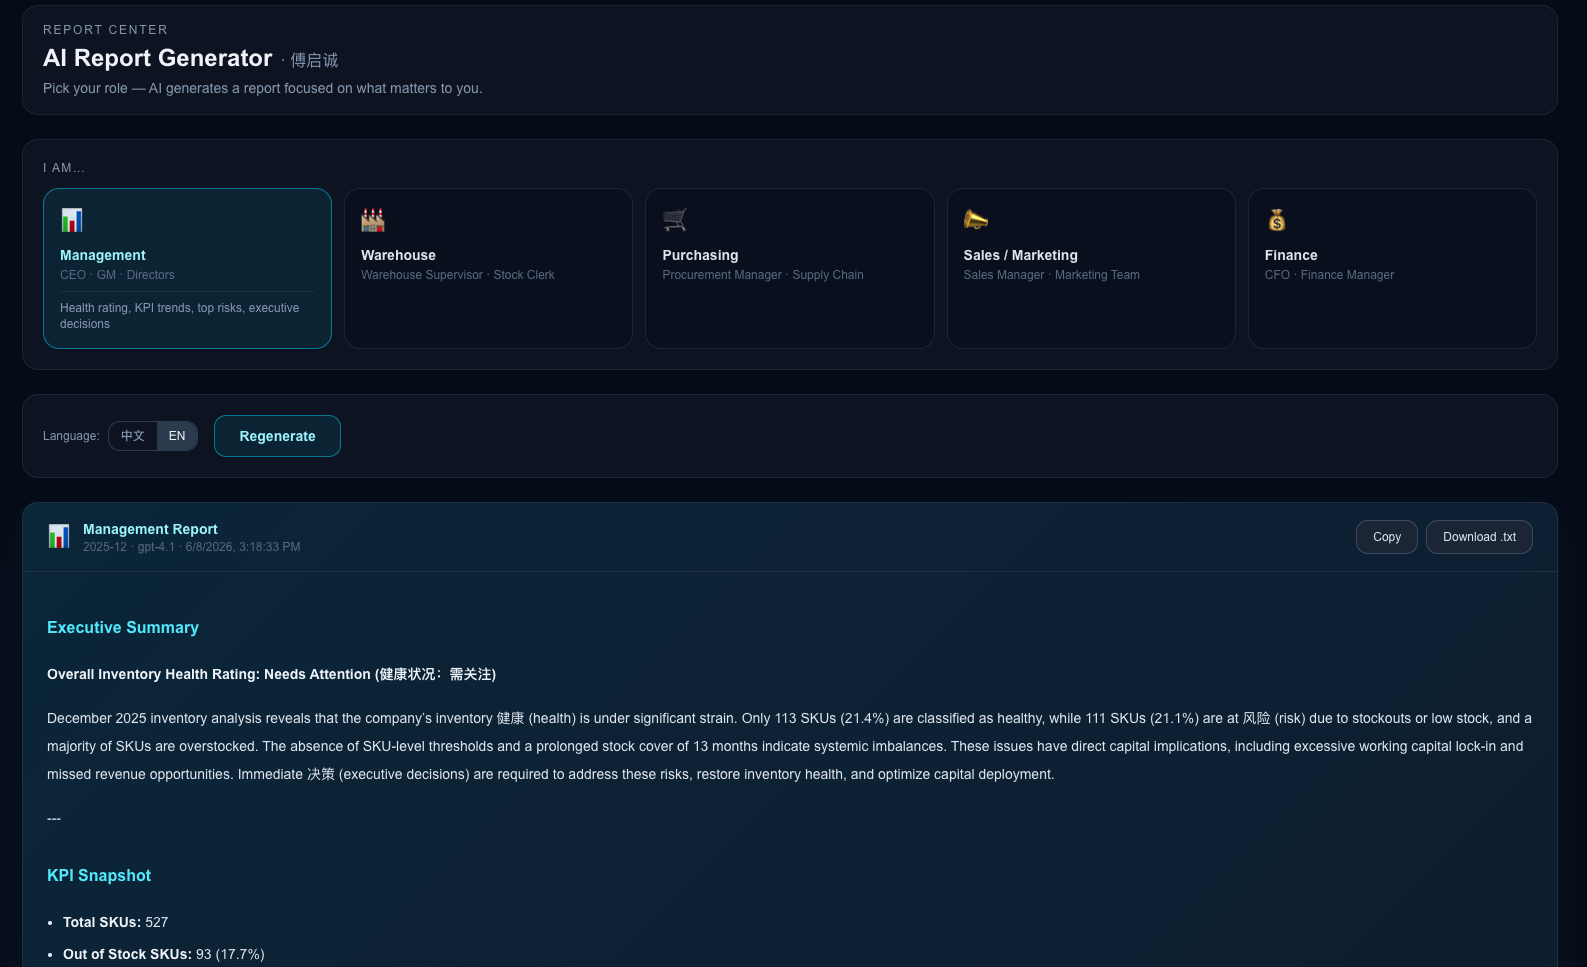
The reporting center packages the analysis into role-specific summaries for management, warehouse, purchasing, sales, or finance so each stakeholder receives a focused narrative instead of generic KPI dumps.

🏗️ System Architecture

1
Oracle ERP Data PipelineEvent-driven listener detects record updates in real time. Automated extraction, transformation, and loading without manual exports.
2
Inventory Analytics EngineSKU-level demand summarization, reorder point calculation using historical velocity + lead time, safety stock recommendations, and slow-mover detection.
3
Operational Dashboards (React/Next.js)Real-time KPI cards, stock risk heat maps, replenishment priority queues, and overstock/understock monitoring designed around warehouse operator workflows.
4
AI Insight LayerIntegrated ML models generate natural-language recommendations, surfacing opportunities that rule-based systems miss.

⚙️ IE Principles Applied

ABC AnalysisSegmented SKUs by consumption value to prioritize monitoring intensity and replenishment urgency.
EOQ / ROPApplied Economic Order Quantity and Reorder Point formulas adapted to dynamic demand environments.
Capacity PlanningMonitored storage utilization trends to flag overflow risk before it impacted operations.
Six SigmaVariance and control-limit logic used to detect anomalous demand patterns and flag outlier SKUs.

📊 Key Capabilities

SKU Coverage
Full Catalog
Data Latency
Real-Time
Replenishment
Automated
AI Insights
Integrated

🛠️ Tech Stack

Oracle ERPPythonReactNext.jsPandas / NumPyStatistical ModelingREST APIsAI/MLData VisualizationSix SigmaABC AnalysisSupply Chain Analytics
Experience

Where I've Worked

Siemens Energy
Jun – Aug 2024
Richland, MS
Industrial Engineer Intern
  • Analyzed pallet inventory, storage utilization, overflow conditions, and rack capacity to support warehouse expansion and storage layout planning.
  • Conducted time studies and work activity analysis to separate value-added work from operational waste and improve labor utilization.
  • Applied Lean Six Sigma, ABC analysis, and core IE methods to strengthen material flow, warehouse organization, and decision support for facility changes.
  • Mapped the return-to-stock process from production through warehouse handoff and translated the workflow into clear operational documentation.
  • Built layout concepts in AutoCAD and prototyped storage-planning components to evaluate practical implementation options.
Hangzhou Forward Fine Chemical Co., Ltd.
May – Jul 2023
Hangzhou, China
Quality Inspection Intern
  • Designed and executed controlled experiments to tune mica optical properties by varying titanium tetrachloride concentrations for customer-specific color requirements.
  • Applied quantitative analysis to evaluate reaction time, reactant dosage, and process-response relationships, then translated the results into charts and technical reports.
  • Synthesized experimental findings into research summaries and presentation materials, creating a clearer basis for follow-on testing and process refinement.
More Projects

Engineering Work

Applying systems thinking to real-world data and sustainability challenges.

Skills

Technical Toolkit

Cross-disciplinary skills spanning industrial engineering, data science, and full-stack development.

⚙️ Industrial Engineering
Process ImprovementTime StudyWarehouse LayoutFacility PlanningInventory AnalysisSPCSix Sigma
🧠 Systems & Decision
Reliability AnalysisDecision ModelingProcess MappingOperational RiskOptimization
📊 Data & Engineering
PythonRMATLABExcelAutoCADSolidWorksDiscrete-Event Sim
💻 Software
ReactNext.jsJavaScriptData VisualizationERP Integration
Let's Connect

Contact Info

Reach out for full-time opportunities, project discussions, or conversations around industrial engineering, supply chain, and operations analytics.